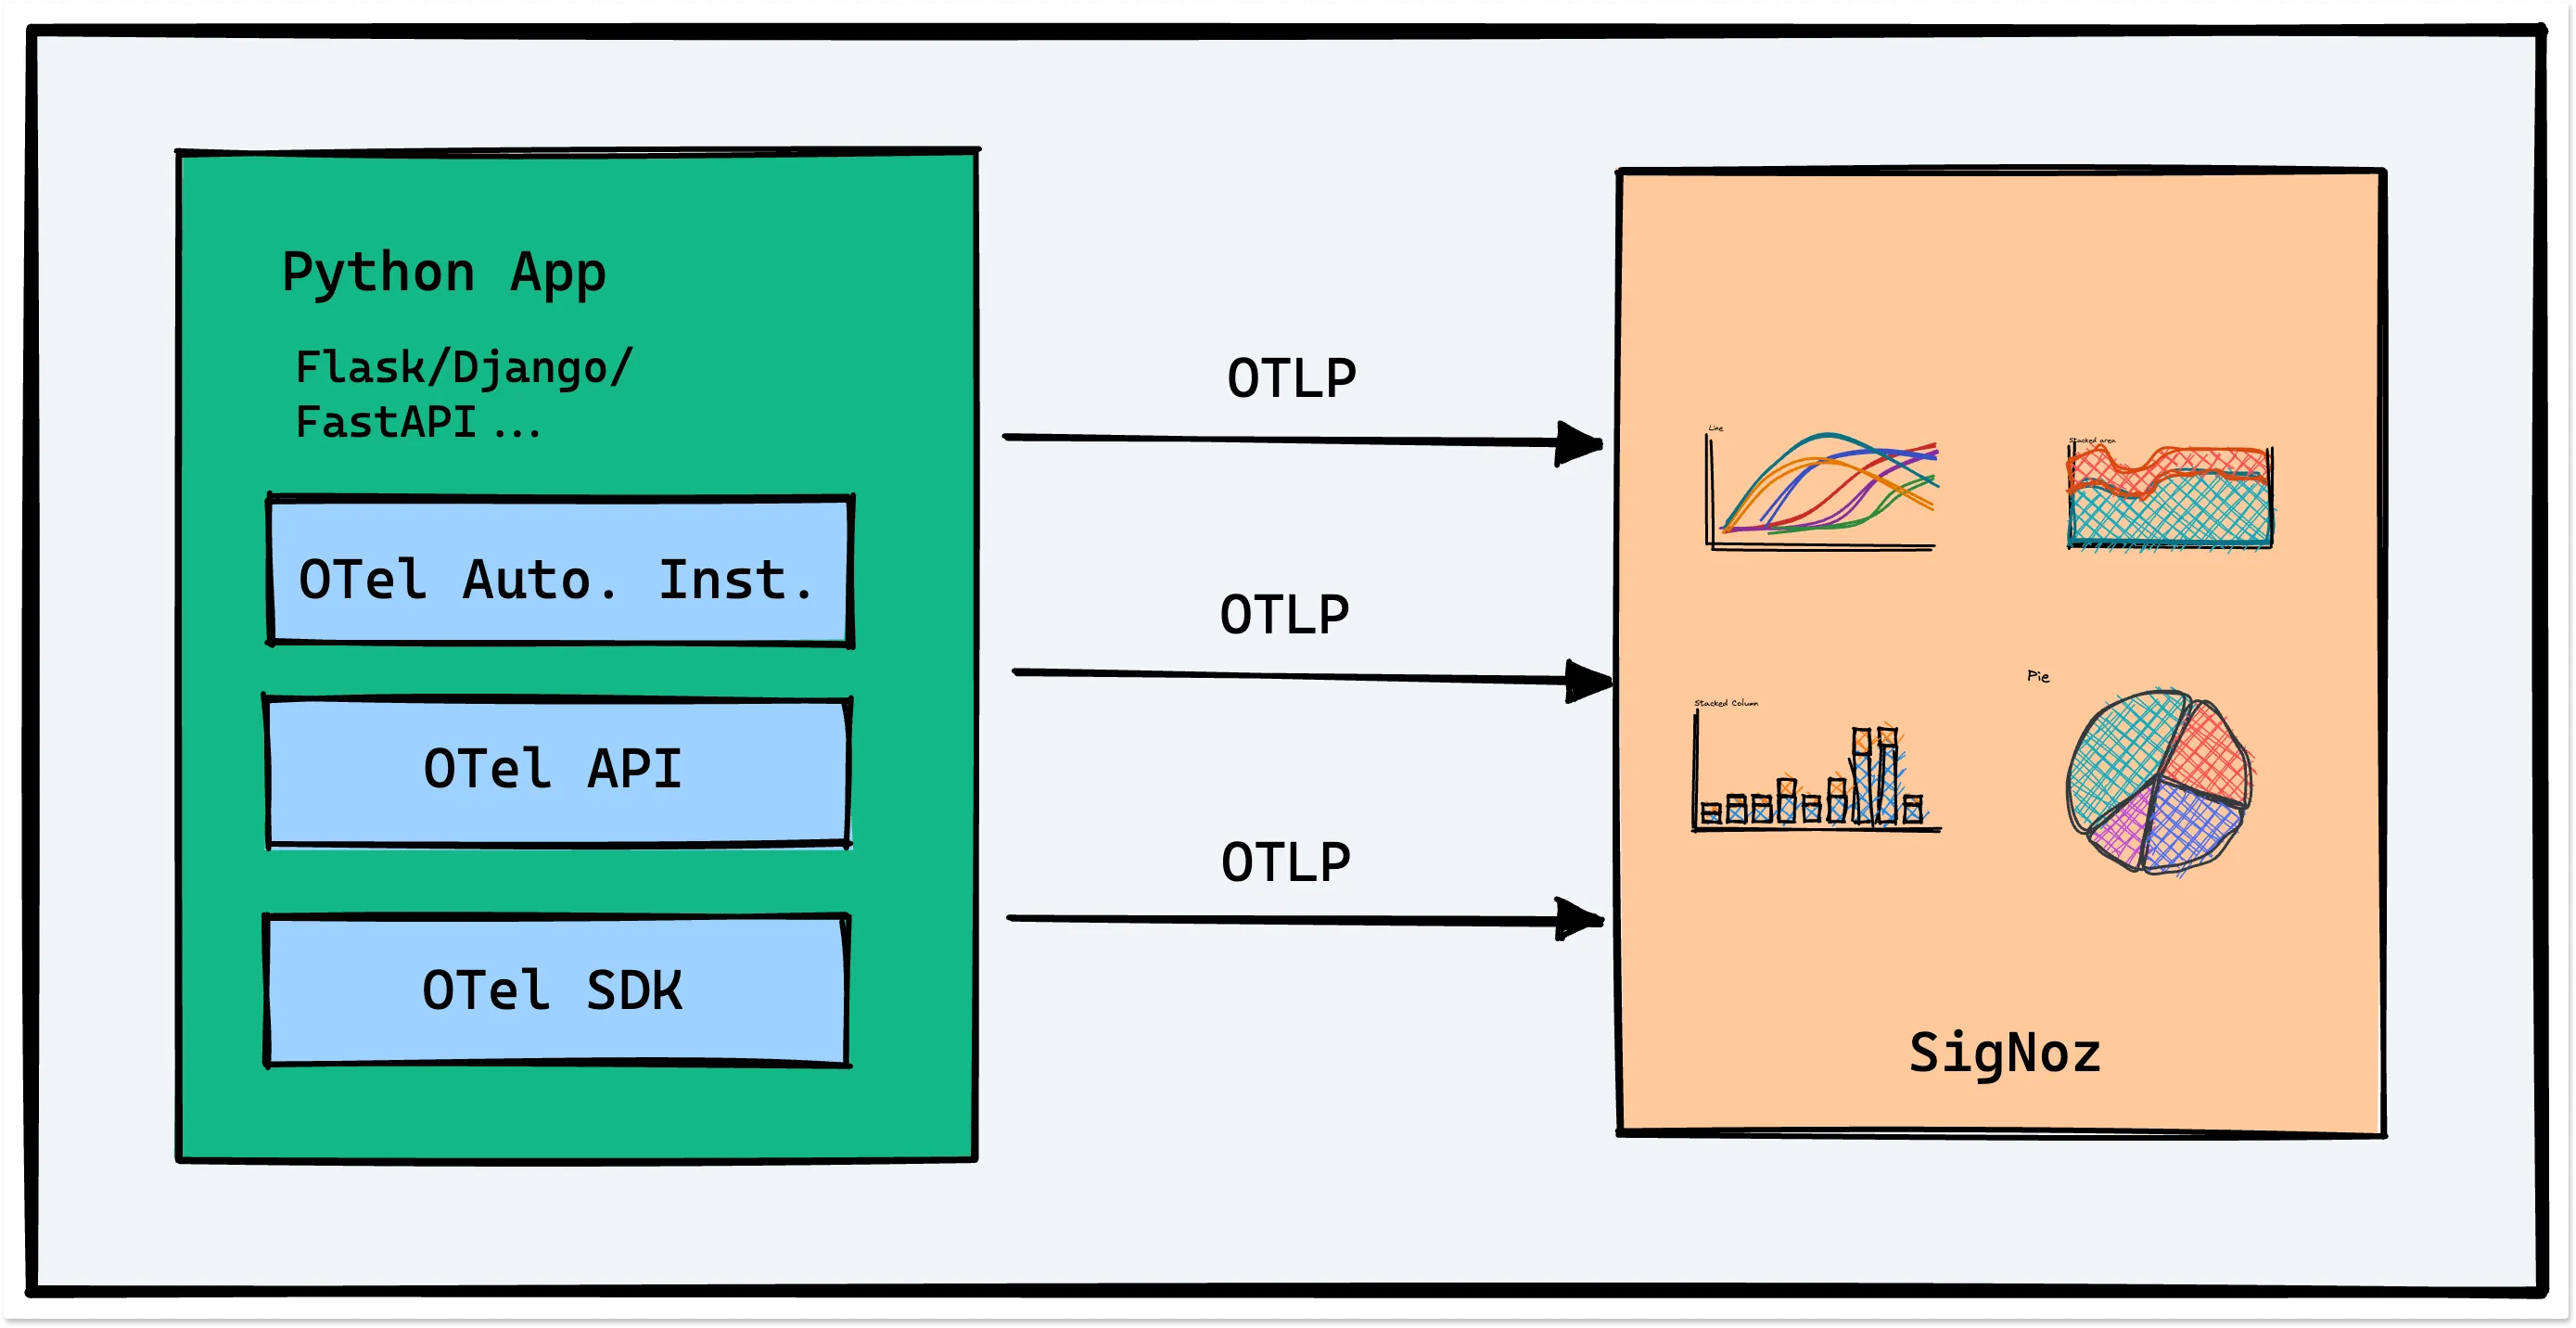
Python OpenTelemetry Instrumentation
OpenTelemetry, also known as OTel for short, is an open source observability framework that can help you generate and collect telemetry data - traces, metrics, and logs from your Python application.

Requirements
- Python 3.8 or newer
Send Traces to SigNoz Cloud
Based on your application environment, you can choose the setup below to send traces to SigNoz Cloud.
From VMs, there are two ways to send data to SigNoz Cloud.
Send traces directly to SigNoz Cloud
Step 1. Create a virtual environment
python3 -m venv .venv
source .venv/bin/activate
Step 2. Install the OpenTelemetry dependencies
pip install opentelemetry-distro==0.43b0
pip install opentelemetry-exporter-otlp==1.22.0
Step 3. Add automatic instrumentation
opentelemetry-bootstrap --action=install
Step 4. Run your application
OTEL_RESOURCE_ATTRIBUTES=service.name=<service_name> \
OTEL_EXPORTER_OTLP_ENDPOINT="https://ingest.{region}.signoz.cloud:443" \
OTEL_EXPORTER_OTLP_HEADERS="signoz-ingestion-key=SIGNOZ_INGESTION_KEY" \
OTEL_EXPORTER_OTLP_PROTOCOL=grpc \
opentelemetry-instrument <your_run_command>
<service_name>is the name of the service you want<your_run_command>can bepython3 app.pyorflask run- Replace
SIGNOZ_INGESTION_KEYwith the api token provided by SigNoz. You can find it in the email sent by SigNoz with your cloud account details.
Depending on the choice of your region for SigNoz cloud, the ingest endpoint will vary according to this table.
| Region | Endpoint |
|---|---|
| US | ingest.us.signoz.cloud:443 |
| IN | ingest.in.signoz.cloud:443 |
| EU | ingest.eu.signoz.cloud:443 |
Step 5. Validate if your application is sending traces to SigNoz cloud by following the instructions here.
In case you encounter an issue where all applications do not get listed in the services section then please refer to the troubleshooting section.
Send traces via OTel Collector binary
OTel Collector binary helps to collect logs, hostmetrics, resource and infra attributes. It is recommended to install Otel Collector binary to collect and send traces to SigNoz cloud. You can correlate signals and have rich contextual data through this way.
You can find instructions to install OTel Collector binary here in your VM. Once you are done setting up your OTel Collector binary, you can follow the below steps for instrumenting your Python application.
Step 1. Install the OpenTelemetry dependencies
pip install opentelemetry-distro==0.43b0
pip install opentelemetry-exporter-otlp==1.22.0
Step 2. Add automatic instrumentation
opentelemetry-bootstrap --action=install
Step 3. To run your application and send data to collector in same VM:
OTEL_RESOURCE_ATTRIBUTES=service.name=<service_name> \
OTEL_EXPORTER_OTLP_ENDPOINT="http://localhost:4317" \
OTEL_EXPORTER_OTLP_PROTOCOL=grpc \
opentelemetry-instrument <your_run_command>
where,
<service_name>is the name of the service you want<your_run_command>can bepython3 app.pyorflask run
In case you have OtelCollector Agent in different VM, replace localhost:4317 with <IP Address of the VM>:4317.
Step 4. You can validate if your application is sending traces to SigNoz cloud by following the instructions here.
In case you encounter an issue where all applications do not get listed in the services section then please refer to the troubleshooting section.
Validating instrumentation by checking for traces
With your application running, you can verify that you’ve instrumented your application with OpenTelemetry correctly by confirming that tracing data is being reported to SigNoz.
To do this, you need to ensure that your application generates some data. Applications will not produce traces unless they are being interacted with, and OpenTelemetry will often buffer data before sending. So you need to interact with your application and wait for some time to see your tracing data in SigNoz.
Validate your traces in SigNoz:
- Trigger an action in your app that generates a web request. Hit the endpoint a number of times to generate some data. Then, wait for some time.
- In SigNoz, open the
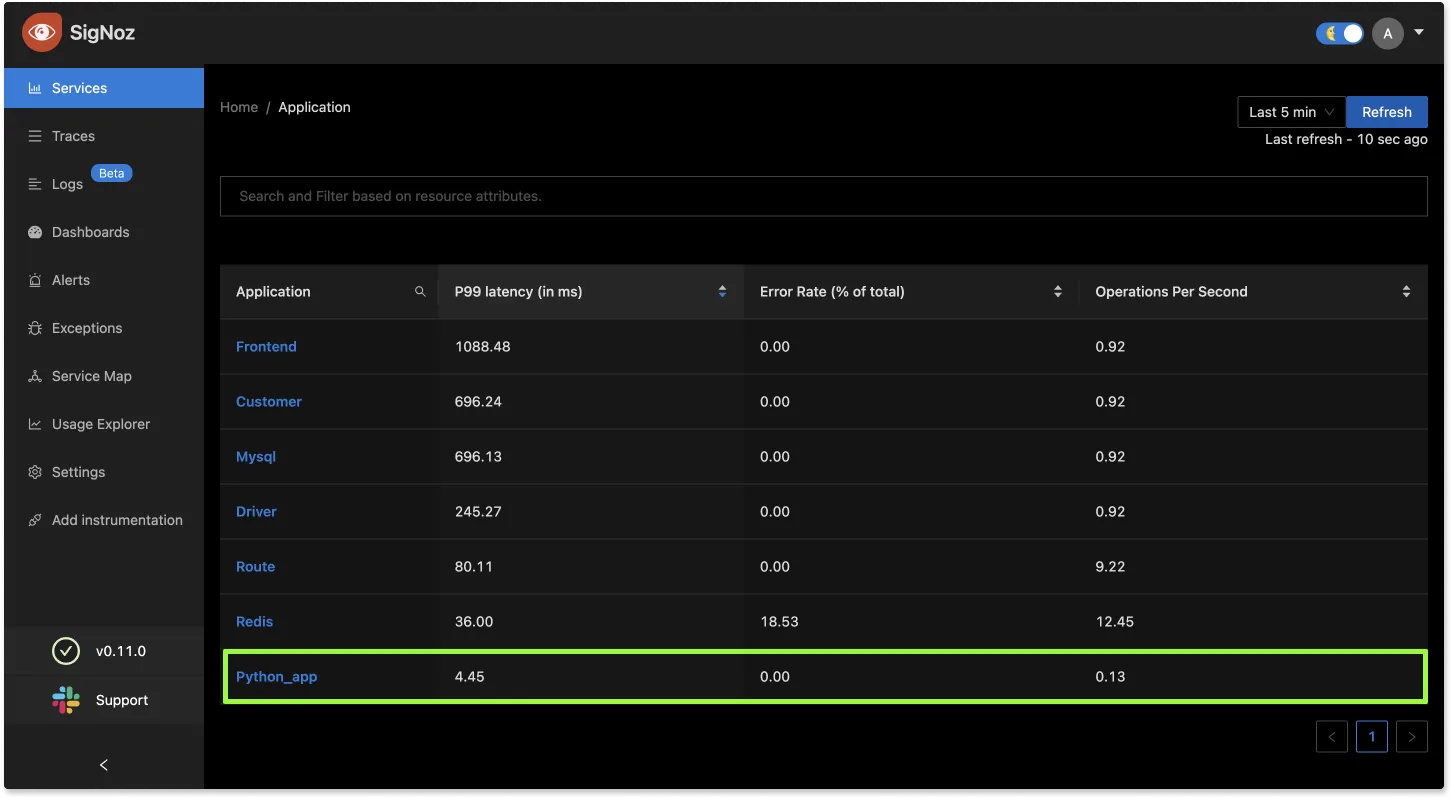
Servicestab. Hit theRefreshbutton on the top right corner, and your application should appear in the list ofApplications. - Go to the
Tracestab, and apply relevant filters to see your application’s traces.
You might see other dummy applications if you’re using SigNoz for the first time. You can remove it by following the docs here.

Database Instrumentation
Make sure that the DB client library you are using has the corresponding instrumentation library, and the version of the DB client library is supported by OpenTelemetry.
MongoDB
You can use opentelemetry-distro to initialize instrumentation for your MongoDB database calls. You need to ensure that the version of your DB client library is supported by OpenTelemetry. For MongoDB, the instrumentation library is opentelemetry-instrumentation-pymongo.
You can check the supported versions here.
Redis
You can use opentelemetry-distro to initialize instrumentation for your Redis database calls. You need to ensure that the version of your DB client library is supported by OpenTelemetry. For Redis, the instrumentation library is opentelemetry-instrumentation-redis.
You can check the supported versions here.
MySQL
You can use opentelemetry-distro to initialize instrumentation for your MySQL database calls. You need to ensure that the version of your DB client library is supported by OpenTelemetry. For MySQL, we have two instrumentation libraries:
- opentelemetry-instrumentation-mysql
- opentelemetry-instrumentation-pymysql
You can check the supported versions here.
Postgres
You can use opentelemetry-distro to initialize instrumentation for your PostgreSQL database calls. You need to ensure that the version of your DB client library is supported by OpenTelemetry. For Postgres, the instrumentation library is opentelemetry-instrumentation-psycopg2.
You can check the supported versions here.
psycopg2-binary is not supported by opentelemetry auto instrumentation libraries as it is not recommended for production use. Please use psycopg2 to see DB calls also in your trace data in SigNoz
Running applications with Gunicorn, uWSGI
For application servers which are based on pre fork model like Gunicorn, uWSGI you have to add a post_fork hook or a @postfork decorator in your configuration.
Check this documentation from OpenTelemetry on how to set it up.
Here's a working example configured with a gunicorn server with post_fork hook.
Troubleshooting your SigNoz installation
Application servers such as Uvicorn, Hypercorn, etc.
- Uvicorn with
--workersflag is not supported. The work around for this is to usegunicornwith uvicorn as the worker classgunicorn -k uvicorn.workers.UvicornWorker. - Hypercorn is not supported. There is no workaround for this. Please follow the issue https://github.com/pgjones/hypercorn/issues/215
Spans are not being reported
If spans are not being reported to SigNoz, try enabling debug exporter which writes the JSON formatted trace data to the console by setting env var OTEL_TRACES_EXPORTER=console.
OTEL_RESOURCE_ATTRIBUTES=service.name=python_app OTEL_TRACES_EXPORTER=console opentelemetry-instrument <your run command>
{
    "name": "alice",
    "context": {
        "trace_id": "0xedb7caf0c8b082a9578460a201759193",
        "span_id": "0x57cf7eee198e1fed",
        "trace_state": "[]"
    },
    "kind": "SpanKind.INTERNAL",
    "parent_id": null,
    "start_time": "2022-03-27T14:55:18.804758Z",
    "end_time": "2022-03-27T14:55:18.804805Z",
    "status": {
        "status_code": "UNSET"
    },
    "attributes": {},
    "events": [],
    "links": [],
    "resource": {
        "telemetry.sdk.language": "python",
        "telemetry.sdk.name": "opentelemetry",
        "telemetry.sdk.version": "1.10.0",
        "service.name": "my-service"
    }
}
Sample Application
- Working example where we have configured a gunicorn server with
post_forkhook.
Frequently Asked Questions
How to find what to use in
IP of SigNozif I have installed SigNoz in Kubernetes cluster?Based on where you have installed your application and where you have installed SigNoz, you need to find the right value for this. Please use this grid to find the value you should use for
IP of SigNozI am sending data from my application to SigNoz, but I don't see any events or graphs in the SigNoz dashboard. What should I do?
This could be because of one of the following reasons:
Your application is generating telemetry data, but not able to connect with SigNoz installation
Please use this troubleshooting guide to find if your application is able to access SigNoz installation and send data to it.
Your application is not actually generating telemetry data
Please check if the application is generating telemetry data first. You can use
Console Exporterto just print your telemetry data in console first. Join our Slack Community if you need help on how to export your telemetry data in consoleYour SigNoz installation is not running or behind a firewall
Please double check if the pods in SigNoz installation are running fine.
docker psorkubectl get pods -n platformare your friends for this.
What Cloud Endpoint Should I Use?
The primary method for sending data to SigNoz Cloud is through OTLP exporters. You can either send the data directly from your application using the exporters available in SDKs/language agents or send the data to a collector agent, which batches/enriches telemetry and sends it to the Cloud.
My Collector Sends Data to SigNoz Cloud
Using gRPC Exporter
The endpoint should be ingest.{region}.signoz.cloud:443, where {region} should be replaced with in, us, or eu. Note that the exporter endpoint doesn't require a scheme for the gRPC exporter in the collector.
# Sample config with `us` region
exporters:
    otlp:
        endpoint: "ingest.us.signoz.cloud:443"
        tls:
            insecure: false
        headers:
            "signoz-ingestion-key": "<SIGNOZ_INGESTION_KEY>"
Using HTTP Exporter
The endpoint should be https://ingest.{region}.signoz.cloud:443, where {region} should be replaced with in, us, or eu. Note that the endpoint includes the scheme https for the HTTP exporter in the collector.
# Sample config with `us` region
exporters:
    otlphttp:
        endpoint: "https://ingest.us.signoz.cloud:443"
        tls:
            insecure: false
        headers:
            "signoz-ingestion-key": "<SIGNOZ_INGESTION_KEY>"
My Application Sends Data to SigNoz Cloud
The endpoint should be configured either with environment variables or in the SDK setup code.
Using Environment Variables
Using gRPC Exporter
Examples with us region
OTEL_EXPORTER_OTLP_PROTOCOL=grpc OTEL_EXPORTER_OTLP_ENDPOINT=https://ingest.us.signoz.cloud:443 OTEL_EXPORTER_OTLP_HEADERS=signoz-ingestion-key=<SIGNOZ_INGESTION_KEY>
Using HTTP Exporter
OTEL_EXPORTER_OTLP_PROTOCOL=http/protobuf OTEL_EXPORTER_OTLP_ENDPOINT=https://ingest.us.signoz.cloud:443 OTEL_EXPORTER_OTLP_HEADERS=signoz-ingestion-key=<SIGNOZ_INGESTION_KEY>
Configuring Endpoint in Code
Please refer to the agent documentation.
Sending Data from a Third-Party Service
The endpoint configuration here depends on the export protocol supported by the third-party service. They may support either gRPC, HTTP, or both. Generally, you will need to adjust the host and port. The host address should be ingest.{region}.signoz.cloud:443, where {region} should be replaced with in, us, or eu, and port 443 should be used.
